
TANKO
Digitaler ZwillingDigital twin Zum Projekt →Open project →TANKO
Digitaler Zwilling eines Chemiestandorts
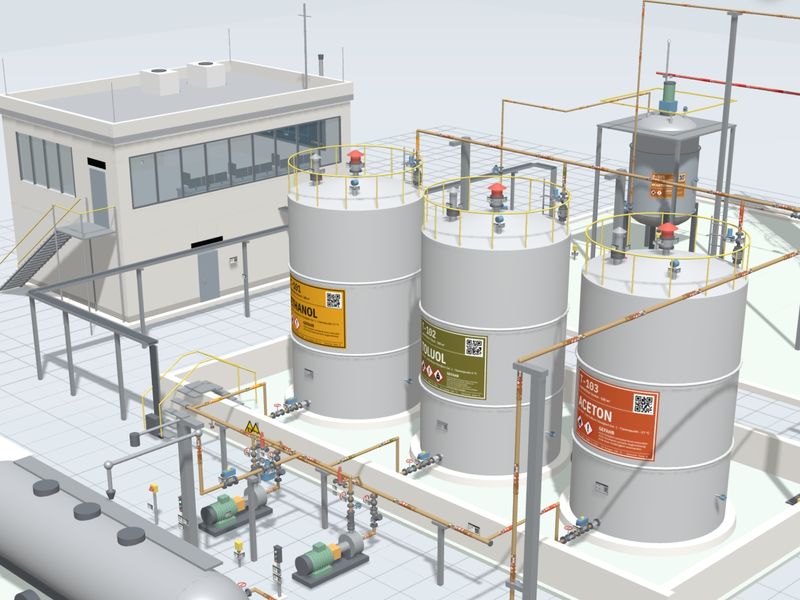
- Tanklager, Produktion, Messwarte und Kesselhaus als begehbares 3D-Modell im Browser.
- Jedes Bauteil mit echtem Kennzeichen, Schild, QR-Code und technischen Daten.
- Sieben Testfälle, von der Leckage bis zum Erdbeben; Kesselhaus mit echten Messdaten.
Digital twin of a chemical site
- Tank farm, production, control room and boiler house as a walkable 3D model in the browser.
- Every component carries a real tag, sign, QR code and technical data.
- Seven test cases, from a leak to an earthquake; boiler house with real measurement data.

ID360°
ObjekterkennungObject identification Zum Projekt →Open project →ID360°
Alles auf einen Blick
- Objekte in der Anlage erkennen: per QR-/DataMatrix-/Barcode, RFID/NFC, UHF-Transponder, Foto mit KI-Bilderkennung oder Text- und Spracheingabe.
- Zeigt das erkannte Objekt mit Kennzeichen, technischen Daten und Gefahrstoffangaben – und rundum alle Beziehungen zu anderen Objekten.
- Arbeitet mit Objektmodellen im JSON-Format, z. B. aus TANKO. Auf Deutsch und Englisch.
Everything at a glance
- Identify objects in the plant: by QR/DataMatrix/barcode, RFID/NFC, UHF transponder, photo with AI image recognition, or text and voice input.
- Shows the identified object with tag, technical data and hazardous-substance information – surrounded by all its relations to other objects.
- Works with object models in JSON format, e.g. from TANKO. In German and English.
FIXO
Störmeldungs-AppFault reporting app Zum Projekt →Open project →FIXO
Störmeldungen einfach erfassen
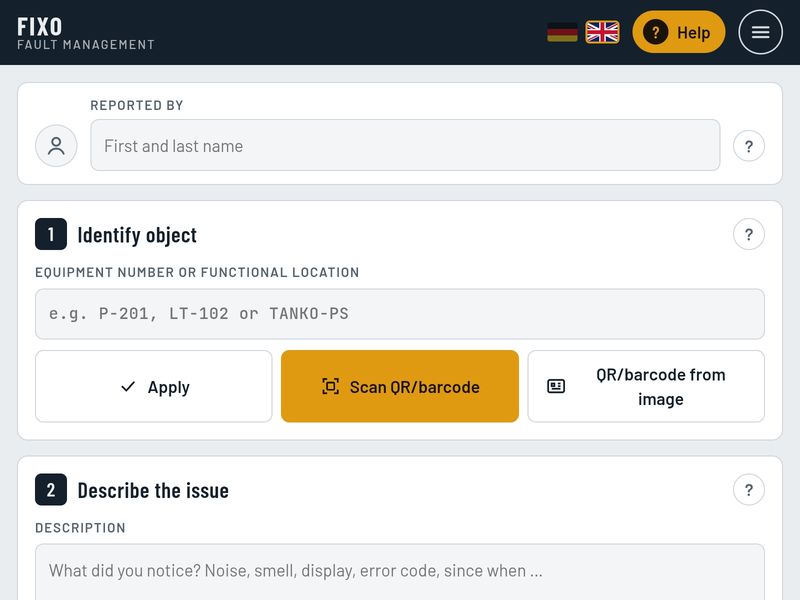
- Anlage per Equipmentnummer, technischem Platz oder QR-/Barcode-Scan identifizieren.
- Störung als Text oder Sprachnachricht beschreiben, Fotos und Videos anhängen.
- Die KI hilft, Schaden, Ursache und Priorität einzuschätzen. Meldungen werden in einer Übersicht gesammelt.
Report faults in seconds
- Identify equipment by number, functional location or QR/barcode scan.
- Describe the issue by text or voice message and attach photos and videos.
- AI helps assess damage, cause and priority. Reports are collected in one overview.
JOIN
BeziehungsmodellRelationship model Zum Projekt →Open project →JOIN
Zusammenhänge als Netzwerk sichtbar machen
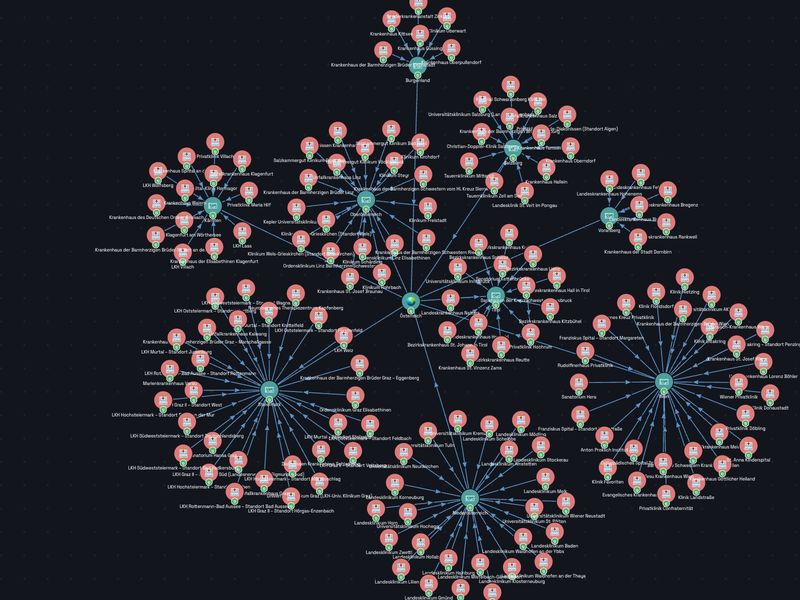
- Daten als interaktiven Netzwerkgraphen darstellen, z. B. alle Krankenhäuser Österreichs nach Bundesland.
- Ansicht in 2D, 3D oder auf der Landkarte (GEO), Ebenen und Filter einstellen.
- Knoten suchen, auch per Sprache oder Kamera. Graphen speichern, öffnen und teilen.
See connections as a network
- Display data as an interactive network graph, e.g. all hospitals in Austria by federal state.
- Switch between 2D, 3D and map view (GEO), and adjust levels and filters.
- Search nodes, also by voice or camera. Save, open and share graphs.
UniqID
UUID-GeneratorUUID generator Zum Projekt →Open project →UniqID
Eindeutige IDs auf Knopfdruck
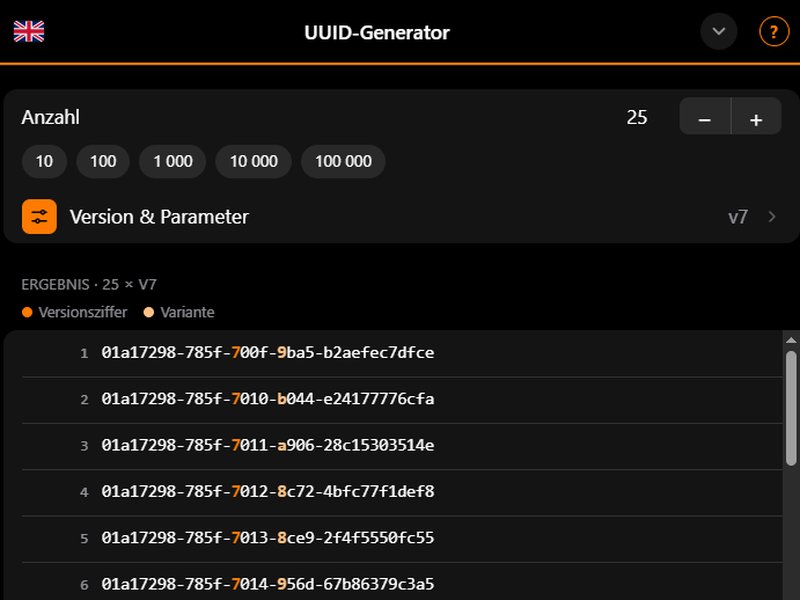
- Erzeugt UUIDs direkt im Browser, von einer bis 100 000 Stück auf einmal.
- Version und Parameter wählbar, z. B. v7 (zeitbasiert und sortierbar); Versionsziffer und Variante werden farbig hervorgehoben.
- Ergebnis mit einem Klick kopieren oder als CSV exportieren. Auf Deutsch und Englisch.
Unique IDs at the push of a button
- Generates UUIDs right in the browser, from one to 100,000 at once.
- Choose version and parameters, e.g. v7 (time-based and sortable); version digit and variant are highlighted in color.
- Copy the result with one click or export it as CSV. In German and English.
LABEL
Etiketten-DesignerLabel designer Zum Projekt →Open project →LABEL
Etiketten und Schilder gestalten und drucken
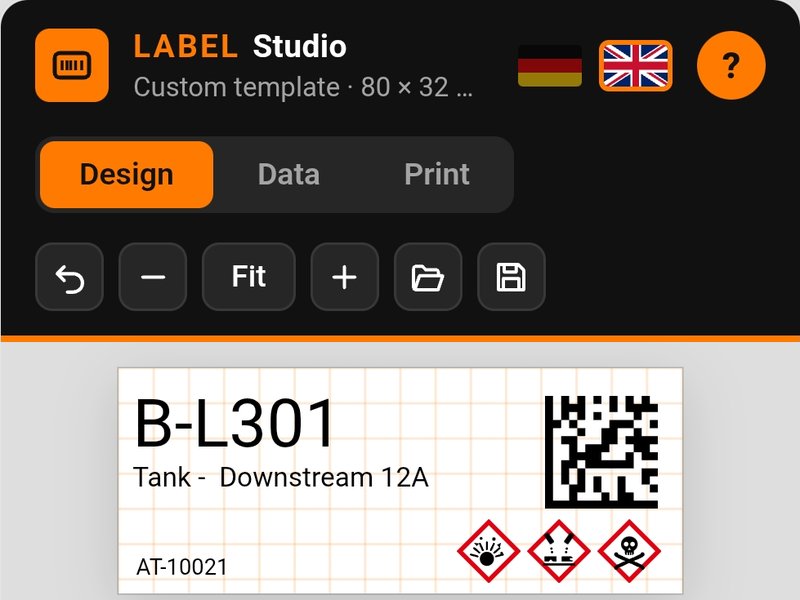
- Etiketten im Browser frei gestalten, z. B. 80 × 32 mm, mit Raster, Zoom und eigenen Vorlagen zum Speichern und Öffnen.
- Texte, Datenfelder, QR- und DataMatrix-Codes sowie GHS-Gefahrenpiktogramme einfügen.
- In drei Schritten: Design, Daten, Druck. Auf Deutsch und Englisch.
Design and print labels and signs
- Design labels freely in the browser, e.g. 80 × 32 mm, with grid, zoom and your own templates to save and open.
- Add text, data fields, QR and DataMatrix codes and GHS hazard pictograms.
- In three steps: design, data, print. In German and English.
Media
Videos, Audios und News rund um die Projekte.Videos, audio and news about the projects.
Videos
Ein Chemiestandort als digitaler Zwilling
Wie eine Störung in einer Chemieanlage entdeckt, mit dem Smartphone gemeldet, von einer KI ausgewertet und in der Messwarte bestätigt wird, ohne eine echte Anlage zu betreten.
A chemical site as a digital twin
How a fault in a chemical plant is detected, reported by smartphone, evaluated by AI and confirmed in the control room, without setting foot in a real plant.
Kurzporträt
TANKO ist ein virtueller Chemiestandort im Browser: ein Tanklager, ein Produktionsbereich, ein Betriebsgebäude mit Messwarte und ein Kesselhaus, alle im Maßstab 1:1 als begehbares 3D-Modell. Jedes Bauteil trägt ein echtes Kennzeichen, ein lesbares Schild mit QR-Code und technische Daten. Störungen, Rundgänge, Drohnenflüge und sogar ein Erdbeben lassen sich als Testfälle abspielen.
TANKO ist der digitale Zwilling, an dem die App FIXO für Störmeldungen, das Beziehungsmodell JOIN und die Zeitreihenanalyse FIXDA ausprobiert und vorgeführt werden. Das Kesselhaus läuft mit echten Messdaten eines Industriekessels.
Kernaussage: Mit TANKO erlebt man in wenigen Minuten, wie eine Störung in einer Chemieanlage entdeckt, mit dem Smartphone gemeldet, von einer KI ausgewertet und in der Messwarte bestätigt wird, ohne eine echte Anlage zu betreten.
TANKO läuft als einzelne HTML-Datei in jedem modernen Browser, am PC wie am Smartphone, auf Deutsch und Englisch.
Die Anlage
Der Standort besteht aus vier Bereichen, die durch Rohrleitungen, Kabeltrassen und Daten verbunden sind. Das Produkt fließt aus der Produktion ins Tanklager und von dort in Tankwagen; die Messwarte überwacht alles.
| Bereich | Was dort steht | Besonderheiten |
|---|---|---|
| Tanklager | Drei Lagerbehälter T-101 bis T-103 zu je 100 m³ für Ethanol, Toluol und Aceton in der Tanktasse TA-01; Pumpenstation mit Betriebs- und Reservepumpe P-201/P-202; Abfüllplatz für Tankwagen | Sicherheitsventile, Berstscheiben, Überfüllsicherungen, Gaswarnanlage, Ex-Zonen 0, 1 und 2 sichtbar einblendbar |
| Produktion | Rührkesselreaktor R-501, 25 m hohe Destillationskolonne K-502 mit Bühnen, Verdampfer, Kondensator, Rücklaufbehälter, Produktkühler, Pumpen P-501 bis P-505 | Produkt nur bei bestandener Analyse über Schnellschlussventil XV-510 ins Tanklager; Heizdampf rot, Kühlwasser grün |
| Betriebsgebäude GB-01 | Erdgeschoss: Transformator, Netzersatzanlage, Hauptverteilung, Motor Control Center, USV. Obergeschoss: Messwarte mit drei Leitständen und Großbildwand | Gebäude lässt sich „öffnen“, um hineinzusehen; Großbildwand zeigt eingehende Störmeldungen |
| Kesselhaus KH-01 | Kohlebefeuerter Wirbelschichtkessel mit Brennkammer, Dampftrommel, zwei Zyklonen, Überhitzern, Economisern, Luftvorwärmern, Gebläsen, Entstauber und Kamin | Nachbau eines realen Kessels mit allen 30 Messstellen und echten Messdaten; Anzeigetafel AT-801 davor |
Alle Rohrleitungen haben eine Nummer und alle 2 m einen Aufkleber mit Fluid, Nennweite, Gefahrenpiktogrammen, Fließrichtung und Strichcode. Jedes Anlagenteil trägt ein Platzschild mit technischem Platz und QR-Code; Behälter, Sensoren und Aktoren haben zusätzlich ein Herstellerschild mit digitalem Identifikationslink nach IEC 61406. Tauben und Spatzen leben in der Anlage, Wind und Vogelgezwitscher sind zu hören.
Funktionen im Überblick
TANKO verbindet ein frei begehbares 3D-Modell mit den Unterlagen und Werkzeugen, die in einer echten Anlage verstreut sind.
- 3D-Modell bedienen: Drehen, Verschieben und Zoomen mit Maus oder Finger, Blickwinkel frei bis 180°, Navigationsscheibe mit Kompass, feste Ansichten (Pumpen, Kolonne, Messwarte, Kesselhaus …) und ein Rundflug.
- Bauteile verstehen: Antippen zeigt Kennzeichen, Funktion und technische Daten. Ebenen blenden Bauteilgruppen, Beschriftungen, Schilder und Ex-Zonen ein und aus.
- Schilder lesen und scannen: Jedes Schild lässt sich vergrößern; QR- und Strichcodes sind echt und mit einem Smartphone scanbar.
- Pumpen schalten: Über die Schaltkombination läuft eine Pumpe an oder aus, Lauflampe und Förderdruck folgen.
- Fließbilder in A1: Verfahrensfließbild (DIN EN ISO 10628-1) und R&I-Fließbild (DIN EN ISO 10628-2, PLT-Stellen nach DIN EN 62424) für Tanklager, Produktion und Kesselhaus, mit Schriftfeld und Stromtabelle. Ein Klick auf ein Symbol springt ins 3D-Modell; Export als SVG.
- Beziehungsmodell JOIN: Jedes Objekt mit seinen Beziehungen, etwa „ist eingebaut in“, „misst“, „fließt nach“, als Netz zum Durchklicken; Import und Export als JSON.
- Logbuch: Testfälle und Störmeldungen werden automatisch eingetragen; eigene Einträge per Tastatur oder Diktat; gemeinsam für alle Nutzer, Export als CSV.
- Video-Export: Testfälle lassen sich als Video aufnehmen und speichern.
- Zweisprachig: Bedienung, Hilfe, Schilder, Aufkleber und Fließbilder auf Deutsch und Englisch.
Testfälle: sieben Szenarien
Sieben Testfälle spielen typische Situationen eines Chemiestandorts automatisch ab. Fast alle folgen demselben Muster: Schaden erkennen, Objekt per Code bestimmen, mit Sprache und Fotos melden, KI-Auswertung, Bestätigung in der Messwarte.
| Nr. | Szenario | Ablauf in Kürze | Dauer |
|---|---|---|---|
| 1 | Leckage an der Pumpe | Öl tritt am Lagerträger von P-201 aus. Ein Schichtmitarbeiter scannt das Platzschild, beschreibt den Schaden per Sprache, macht drei Fotos und sendet die Meldung in FIXO. In der Messwarte ergänzt die KI Text, Ursachencode und Schadensbericht; der Mitarbeiter bestätigt. | ca. 1,5 min |
| 2 | Tropfender Blindflansch | Produkt tropft an ES-201 und verdampft, die Gaswarnung schlägt an. Der Mitarbeiter bleibt 6 m entfernt, scannt den Rohrleitungsaufkleber, fotografiert mit Zoom und markiert die Schadstelle mit einem Kreis. | ca. 1,5 min |
| 3 | Motor überhitzt | Motor M-201 läuft heiß, raucht, vibriert und schleift hörbar. Der Mitarbeiter scannt das Motorschild, schaltet die Pumpe ab, die Reservepumpe übernimmt; danach Meldung wie in Testfall 1. | ca. 1,5 min |
| 4 | Drohneninspektion | Die Drohne UAV-01 fliegt über Tankdächer, Reaktor und Kolonne. Auf der Kopfbühne findet sie einen toten Vogel, scannt den QR-Code und meldet ihn mit zwei Fotos. Die Kamera wechselt zwischen Vogelperspektive und Drohnenkamera mit Flugdaten. | ca. 65 s |
| 5 | Schichtrundgang | Ein Anlagenfahrer in voller Schutzausrüstung geht 11 Prüfstellen ab, scannt die Platzschilder mit dem Ex-Smartphone und füllt eine digitale Checkliste aus. Zwei Befunde gehen als Meldung an FIXO. | ca. 2 min |
| 6 | Erdbeben | Die Erde bebt 5 s, Vögel fliegen auf. Danach laufen an vier Stellen Flüssigkeiten aus und bilden Lachen. Die Drohne fliegt alle Schadstellen an und meldet sie über FIXO. Der Schichtleiter löst die Evakuierung aus: Sirene und Durchsage. | ca. 1,5 min |
| 7 | Begehung mit Smartphone | Interaktiv: Der Nutzer lotst einen Mitarbeiter per Maus oder Finger durch die Anlage. Das Smartphone-Symbol am Rücken öffnet die echte FIXO-Web-App; durch die Handykamera wird ein Schild anvisiert und gescannt, dann wird die Meldung aufgenommen. | frei |
Während eines Testfalls erscheinen Erklärungen in einer einklappbaren Leiste. Jeder Testfall landet im Logbuch und lässt sich als Video exportieren.
Echte Messdaten: Kesselhaus, Anzeigetafel und FIXDA
Das Kesselhaus ist der Nachbau eines realen Industriekessels und läuft mit dessen veröffentlichten Betriebsdaten. Damit zeigt TANKO nicht nur Geometrie, sondern echtes Anlagenverhalten.
- Datenquelle: Der Datensatz „Time-Series of Industrial Boiler Operations“ (Hu et al., Scientific Data 2025, CC BY 4.0) stammt von einem Kessel einer Chemieanlage in China. Er enthält 30 Messstellen im 5-Sekunden-Takt vom 27. März bis 1. April 2022, insgesamt 86 400 Zeitpunkte.
- 1:1 im Modell: Alle 30 Messstellen sitzen mit ihren Original-Kennzeichen am passenden Anlagenteil, etwa TE_8332A für die Frischdampftemperatur oder ZZQBCHLL für die Dampfmenge. Die Messwerte laufen beim Abspielen live an den Messstellen mit.
- Anzeigetafel AT-801: Vor dem Kesselhaus steht eine große Tafel mit einem virtuellen Einschalter. Eingeschaltet zeigt sie vier Kurvendiagramme mit Werteskala; mit Pfeiltasten blättert man durch alle 30 Messstellen. Große nummerierte Pfeile markieren im Modell, welche Messstellen gerade angezeigt werden; ein Klick auf eine Nummer springt hin.
- FIXDA: Ein Klick auf die Tafel öffnet FIXDA, eine eigene Seite für Zeitreihen und Anomalieerkennung. Vier Methoden suchen Auffälligkeiten: Grenzwertverletzung (Frischdampftemperatur außerhalb 530–545 °C, in 8 % der Zeit), statistische Ausreißer, eingefrorene Signale und Datenlücken. Jedes Ereignis steht mit Beginn, Dauer und Extremwert in einer Liste.
- Von der Kurve zur Störmeldung: „Meldung in FIXO“ macht ein Bild des aktuellen Diagramms, formuliert die Situation automatisch und sendet die Meldung. Die KI schlägt Schadens- und Ursachencode, Priorität und Maßnahme vor. „Im Modell zeigen“ holt TANKO nach vorne und fliegt zur Messstelle.
Zusammenspiel mit FIXO und JOIN
TANKO ist die gemeinsame Bühne für drei Werkzeuge: Die Kennzeichen im Modell sind dieselben wie in FIXO und JOIN, deshalb passt jede Meldung und jede Beziehung zum richtigen Objekt.
| Werkzeug | Aufgabe | Verbindung zu TANKO |
|---|---|---|
| FIXO | App für Störmeldungen: Objekt per QR- oder Strichcode bestimmen, Schaden per Sprache beschreiben, Fotos, Senden, KI-Auswertung, Bestätigung | Die Schilder im Modell sind mit FIXO scanbar. In Testfall 7 läuft die echte FIXO-Web-App im virtuellen Smartphone; eine Simulator-Schnittstelle liefert Scan und Fotos aus der 3D-Kamera und meldet die gesendete Störung an Logbuch und Großbildwand zurück. |
| JOIN | Objekt-Beziehungsmodell: welches Teil ist wo eingebaut, was misst was, was fließt wohin | TANKO liefert sein Modell als JSON für JOIN, inklusive Kesselhaus, Zeitreihen und FIXDA. Von jedem Objekt führt ein Klick zum Diagramm oder zur Position im 3D-Modell. |
| FIXDA | Zeitreihen und Anomalieerkennung | Bekommt die Messdaten direkt aus TANKO; Anomalien werden mit einem Klick zur FIXO-Meldung. |
So entsteht eine durchgängige Kette: Messwert, Anomalie, Meldung, KI-Auswertung, Bestätigung, Logbuch.
Nutzen und Zielgruppen
TANKO macht Abläufe sichtbar, die man in einer echten Anlage nur mit Aufwand, Risiko oder gar nicht vorführen kann.
| Zielgruppe | Nutzen |
|---|---|
| Betreiber und Instandhaltung | Störmanagement, Rundgänge und Drohneninspektion durchspielen, bevor sie im Werk eingeführt werden |
| Schichtpersonal und Auszubildende | Anlage, Schilder, Ex-Zonen und Meldeabläufe gefahrlos kennenlernen, auch Notfälle wie Leckage oder Erdbeben |
| Softwareentwicklung | FIXO, JOIN und FIXDA gegen eine realistische Anlage mit echten Kennzeichen und echten Messdaten testen |
| Vertrieb und Präsentation | Das Zusammenspiel der Werkzeuge in wenigen Minuten zeigen, im Browser, ohne Installation |
| Planung und Dokumentation | 3D-Modell, Fließbilder nach DIN, Rohrleitungsliste und Beziehungsmodell aus einer Quelle |
Kernbotschaften
- TANKO ist ein digitaler Zwilling eines Chemiestandorts, der im Browser läuft.
- Störungen werden mit dem Smartphone in Sekunden gemeldet und von einer KI ausgewertet.
- Das Kesselhaus zeigt echte Betriebsdaten und erkennt Anomalien automatisch.
- FIXO, JOIN und FIXDA arbeiten über dieselben Kennzeichen nahtlos zusammen.
At a glance
TANKO is a virtual chemical site in the browser: a tank farm, a production area, an operations building with a control room and a boiler house, all at 1:1 scale as a walkable 3D model. Every component carries a real tag, a readable sign with a QR code and technical data. Faults, inspection rounds, drone flights and even an earthquake can be played back as test cases.
TANKO is the digital twin on which the FIXO fault-reporting app, the JOIN relationship model and the FIXDA time-series analysis are tried out and demonstrated. The boiler house runs on real measurement data from an industrial boiler.
Key message: With TANKO you experience in just a few minutes how a fault in a chemical plant is detected, reported by smartphone, evaluated by AI and confirmed in the control room, without setting foot in a real plant.
TANKO runs as a single HTML file in any modern browser, on PC and smartphone, in German and English.
The plant
The site consists of four areas connected by pipelines, cable trays and data. Product flows from production to the tank farm and from there into tanker trucks; the control room monitors everything.
| Area | What is there | Special features |
|---|---|---|
| Tank farm | Three storage tanks T-101 to T-103, 100 m³ each, for ethanol, toluene and acetone in bund TA-01; pump station with duty and standby pump P-201/P-202; tanker loading bay | Safety valves, rupture discs, overfill protection, gas detection system; hazardous zones 0, 1 and 2 can be shown |
| Production | Stirred-tank reactor R-501, 25 m distillation column K-502 with platforms, reboiler, condenser, reflux drum, product cooler, pumps P-501 to P-505 | Product goes to the tank farm via shut-off valve XV-510 only after a passed analysis; heating steam red, cooling water green |
| Operations building GB-01 | Ground floor: transformer, emergency generator, main distribution, motor control center, UPS. Upper floor: control room with three operator stations and a video wall | The building can be “opened” to look inside; the video wall shows incoming fault reports |
| Boiler house KH-01 | Coal-fired fluidized-bed boiler with combustion chamber, steam drum, two cyclones, superheaters, economizers, air preheaters, fans, dust collector and stack | Replica of a real boiler with all 30 measuring points and real measurement data; display board AT-801 in front |
Every pipeline has a number and, every 2 m, a label showing fluid, nominal size, hazard pictograms, flow direction and barcode. Every plant component carries a location sign with functional location and QR code; vessels, sensors and actuators additionally have a nameplate with a digital identification link according to IEC 61406. Pigeons and sparrows live in the plant, and wind and birdsong can be heard.
Features at a glance
TANKO combines a freely walkable 3D model with the documents and tools that are scattered across a real plant.
- Navigate the 3D model: Rotate, pan and zoom with mouse or finger, free viewing angle up to 180°, navigation dial with compass, fixed views (pumps, column, control room, boiler house …) and a flyover.
- Understand components: Tapping shows tag, function and technical data. Layers show or hide component groups, labels, signs and hazardous zones.
- Read and scan signs: Every sign can be enlarged; QR codes and barcodes are real and can be scanned with a smartphone.
- Switch pumps: A switch combination starts or stops a pump; the run lamp and discharge pressure follow.
- A1 flow diagrams: Process flow diagram (DIN EN ISO 10628-1) and P&ID (DIN EN ISO 10628-2, instrumentation according to DIN EN 62424) for tank farm, production and boiler house, with title block and stream table. Clicking a symbol jumps into the 3D model; export as SVG.
- JOIN relationship model: Every object with its relationships, such as “is installed in”, “measures”, “flows to”, as a clickable network; import and export as JSON.
- Logbook: Test cases and fault reports are logged automatically; own entries by keyboard or dictation; shared by all users, export as CSV.
- Video export: Test cases can be recorded and saved as video.
- Bilingual: User interface, help, signs, labels and flow diagrams in German and English.
Test cases: seven scenarios
Seven test cases automatically play back typical situations at a chemical site. Almost all follow the same pattern: detect the damage, identify the object by code, report with voice and photos, AI evaluation, confirmation in the control room.
| No. | Scenario | Sequence in brief | Duration |
|---|---|---|---|
| 1 | Pump leak | Oil leaks from the bearing bracket of P-201. A shift worker scans the location sign, describes the damage by voice, takes three photos and sends the report in FIXO. In the control room, the AI adds text, cause code and damage report; the worker confirms. | approx. 1.5 min |
| 2 | Dripping blind flange | Product drips at ES-201 and evaporates; the gas alarm goes off. The worker stays 6 m away, scans the pipeline label, takes a zoomed photo and marks the damage with a circle. | approx. 1.5 min |
| 3 | Motor overheating | Motor M-201 runs hot, smokes, vibrates and audibly grinds. The worker scans the motor nameplate and stops the pump; the standby pump takes over. Then the report follows as in test case 1. | approx. 1.5 min |
| 4 | Drone inspection | Drone UAV-01 flies over tank roofs, reactor and column. On the top platform it finds a dead bird, scans the QR code and reports it with two photos. The camera switches between bird's-eye view and drone camera with flight data. | approx. 65 s |
| 5 | Shift inspection round | An operator in full protective equipment walks 11 checkpoints, scans the location signs with the Ex-rated smartphone and fills in a digital checklist. Two findings are sent to FIXO as reports. | approx. 2 min |
| 6 | Earthquake | The ground shakes for 5 s and birds take off. Then liquids leak at four points and form pools. The drone flies to every damage point and reports it via FIXO. The shift supervisor triggers the evacuation: siren and announcement. | approx. 1.5 min |
| 7 | Walkthrough with smartphone | Interactive: the user guides a worker through the plant with mouse or finger. The smartphone icon on the worker's back opens the real FIXO web app; a sign is targeted and scanned through the phone camera, and the report is recorded. | open |
During a test case, explanations appear in a collapsible bar. Every test case is entered in the logbook and can be exported as video.
Real measurement data: boiler house, display board and FIXDA
The boiler house is a replica of a real industrial boiler and runs on its published operating data. This means TANKO shows not just geometry but real plant behavior.
- Data source: The dataset “Time-Series of Industrial Boiler Operations” (Hu et al., Scientific Data 2025, CC BY 4.0) comes from a boiler at a chemical plant in China. It contains 30 measuring points at 5-second intervals from 27 March to 1 April 2022, a total of 86,400 time stamps.
- 1:1 in the model: All 30 measuring points sit with their original tags on the matching plant component, for example TE_8332A for the live steam temperature or ZZQBCHLL for the steam flow. During playback, the values update live at the measuring points.
- Display board AT-801: In front of the boiler house stands a large board with a virtual power switch. When switched on, it shows four trend charts with value scales; arrow keys page through all 30 measuring points. Large numbered arrows in the model mark which measuring points are currently displayed; clicking a number jumps there.
- FIXDA: Clicking the board opens FIXDA, a separate page for time series and anomaly detection. Four methods look for anomalies: limit violations (live steam temperature outside 530–545 °C, 8 % of the time), statistical outliers, frozen signals and data gaps. Every event is listed with start, duration and extreme value.
- From trend to fault report: “Report in FIXO” takes a picture of the current chart, describes the situation automatically and sends the report. The AI suggests damage and cause codes, priority and action. “Show in model” brings TANKO to the front and flies to the measuring point.
Interaction with FIXO and JOIN
TANKO is the shared stage for three tools: the tags in the model are the same as in FIXO and JOIN, so every report and every relationship belongs to the right object.
| Tool | Purpose | Connection to TANKO |
|---|---|---|
| FIXO | Fault-reporting app: identify the object by QR code or barcode, describe the damage by voice, photos, send, AI evaluation, confirmation | The signs in the model can be scanned with FIXO. In test case 7, the real FIXO web app runs on the virtual smartphone; a simulator interface supplies the scan and photos from the 3D camera and reports the submitted fault back to the logbook and video wall. |
| JOIN | Object relationship model: which part is installed where, what measures what, what flows where | TANKO provides its model as JSON for JOIN, including boiler house, time series and FIXDA. From every object, one click leads to the chart or to its position in the 3D model. |
| FIXDA | Time series and anomaly detection | Receives the measurement data directly from TANKO; one click turns an anomaly into a FIXO report. |
The result is a seamless chain: measured value, anomaly, report, AI evaluation, confirmation, logbook.
Benefits and target groups
TANKO makes processes visible that can be demonstrated in a real plant only with effort and risk, or not at all.
| Target group | Benefit |
|---|---|
| Operators and maintenance | Rehearse fault management, inspection rounds and drone inspection before introducing them at the plant |
| Shift staff and trainees | Get to know the plant, signs, hazardous zones and reporting procedures safely, including emergencies such as leaks or earthquakes |
| Software development | Test FIXO, JOIN and FIXDA against a realistic plant with real tags and real measurement data |
| Sales and presentation | Show how the tools work together in a few minutes, in the browser, without installation |
| Planning and documentation | 3D model, DIN flow diagrams, pipeline list and relationship model from a single source |
Key messages
- TANKO is a digital twin of a chemical site that runs in the browser.
- Faults are reported by smartphone in seconds and evaluated by AI.
- The boiler house shows real operating data and detects anomalies automatically.
- FIXO, JOIN and FIXDA work together seamlessly through the same tags.
Objekte erkennen – alles auf einen Blick
Per Code, RFID, UHF, Foto oder Sprache erkennt ID360° jedes Objekt der Anlage und zeigt technische Daten, Gefahrstoffe und alle Beziehungen aus dem Modell JOIN.
Identify objects – everything at a glance
By code, RFID, UHF, photo or voice, ID360° identifies every object in the plant and shows technical data, hazardous substances and all relations from the JOIN model.
BroschüreBrochure
ID360° auf 8 Seiten: Herausforderung, fünf Wege der Erkennung, Beziehungsmodell, Anzeige und Vorteile.ID360° on 8 pages: the challenge, five ways of identification, relationship model, display and benefits (in German).